Hey, check out my Modern Python Projects course. It's an extended version of this workshop!
Miscellaneous
Docker extension
If you are using Docker, check out the Docker extension. It gives you a new sidebar with a list of containers, images, volumes, etc. You can start/stop/restart containers, connect to a running container with Shell, or attach a VS Code to a running container.
This last option is interesting - VS Code has introduced this idea of “Developing inside a Container”. It lets you mount your code inside a Docker container and run VS Code there. You can use it to make debugging Docker applications easier or to create a sandboxed development setup that can be moved between computers.
Live Share
If you work remotely and you want to show your colleague something in the code (maybe you want to do some pair programming), that’s the extension for you. With Live Share, you can give someone access to your VS Code editor. By default, they can only follow your cursor (useful for onboarding new team members). But if you change the session settings, they will be able to edit the code and access the terminal or localhost server.
Tips & Trick
Here is a bag of tricks that I found when using VS Code.
Pressing the “Alt”/“Option” key while hovering over the split window will let you do a horizontal split instead:
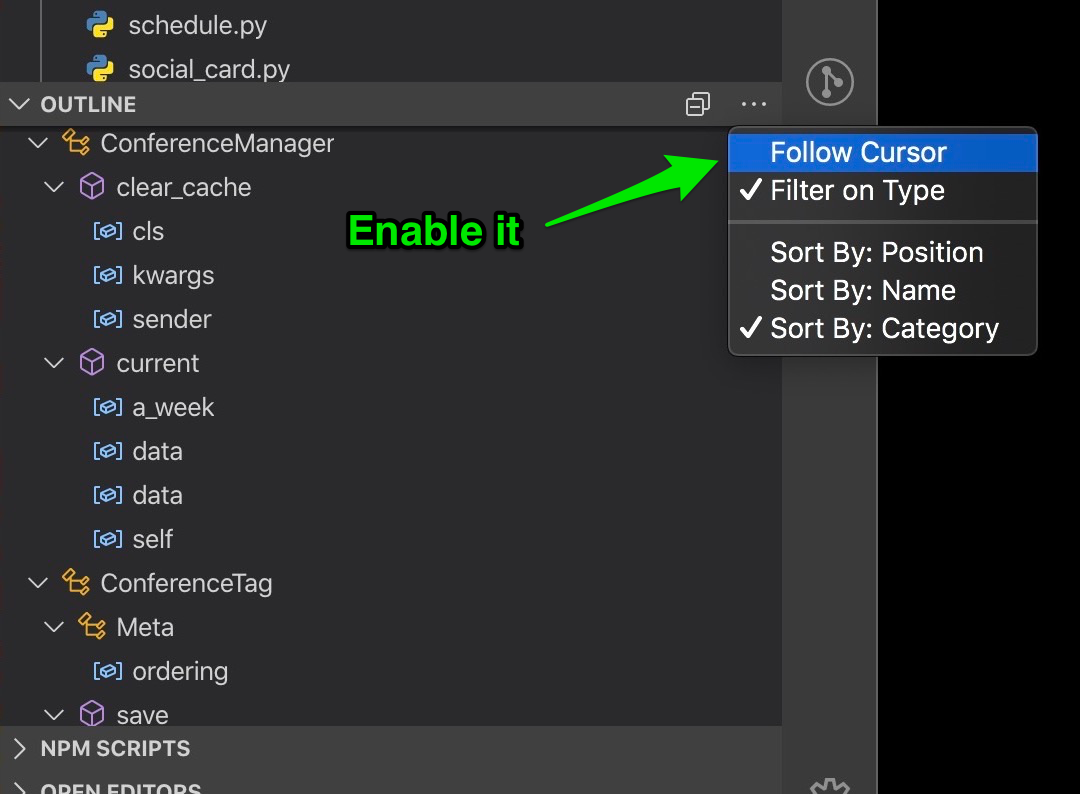
In the outline view on the right, you can enable the “Follow Cursor” option. That way, you will always see the methods, classes, and variables that are relevant to where you are in the code.
When you are creating a new file in the files explorer, you can use / in the file name to define parent folders. This will save you from creating the directory structure and files separately. For example, if you select “New File” and name it “tests/test_views.py”, it will automatically create the “tests” folder with “test_views.py” inside.
Troubleshooting
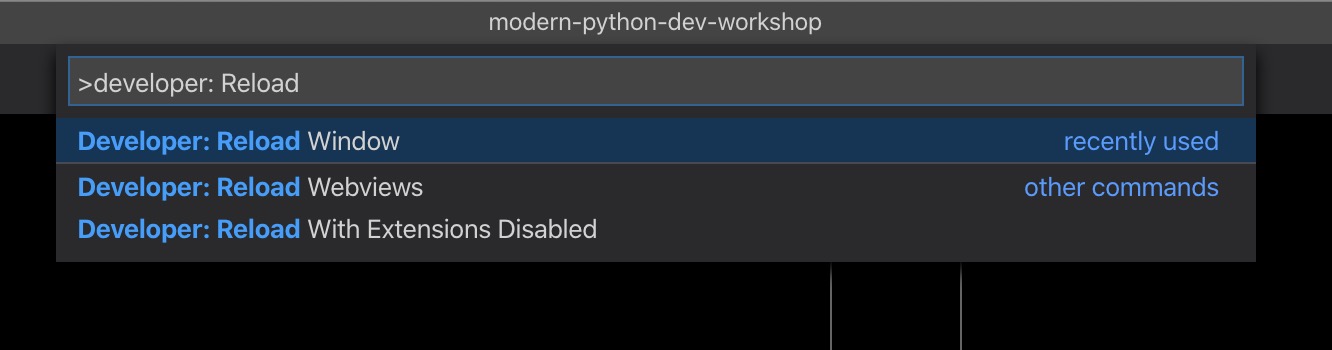
“Restarting VS” Code
When something doesn’t work, you don’t have to close the VS Code and open it again (like with most software). There is an option in the Command Pallete called: “Developer: Reload Window” that will restart VS Code for you. It saves you a few seconds and some unnecessary clicks.
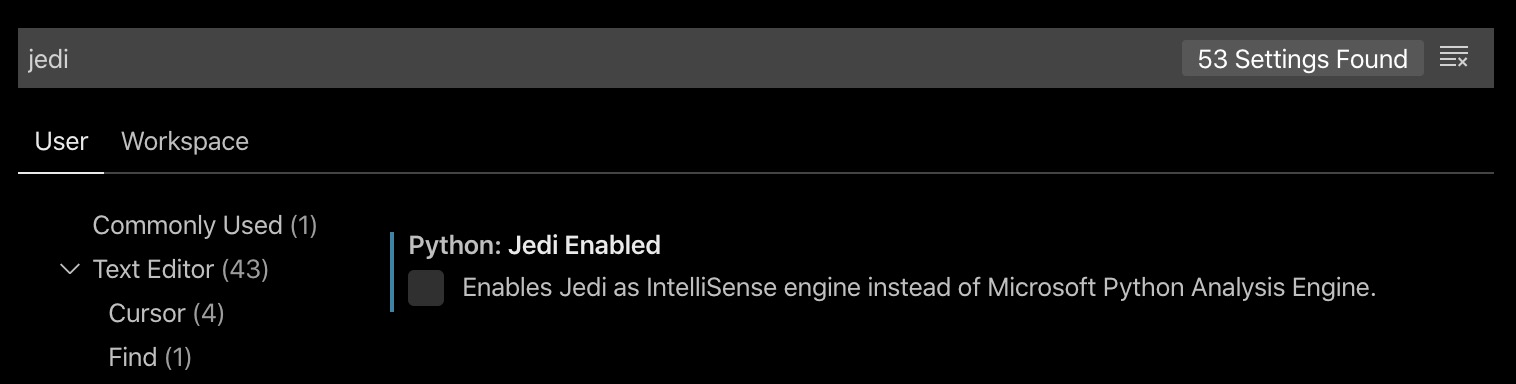
Different autocompletion engine
Sometimes the “show symbols” or “go to definition” will stop working (at least for me). If that happens, try to reload the VS Code. It this doesn’t help, try using a different autocompletion engine. The default one is Intellisense, but Python extension comes with a Jedi tool that servers the same purpose. And often, switching the autocompletion engine fixes the symbols and “go to definition” for me. You can do this in the settings:
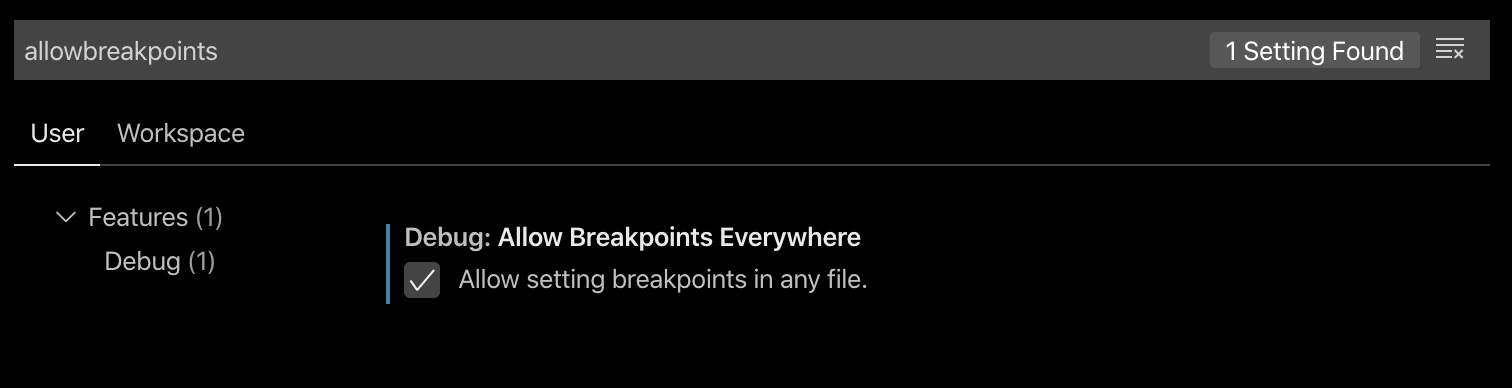
Put breakpoints in every file
When working with Django or Flask, VS Code lets you put breakpoints in your templates (if you are using the Django/Flask debugger that I mentioned in the “Debugging” section of the workshop). However, sometimes, VS Code will get confused if the HTML file you are editing is really a Django template file or not, and maybe it won’t let you add a breakpoint. To solve this problem, open the settings, search for allowbreakpoints, and check the “Debug: Allow Breakpoints Everywhere” option. This will let you set the breakpoints in any file.