Hey, check out my Modern Python Projects course. It's an extended version of this workshop!
Debugging
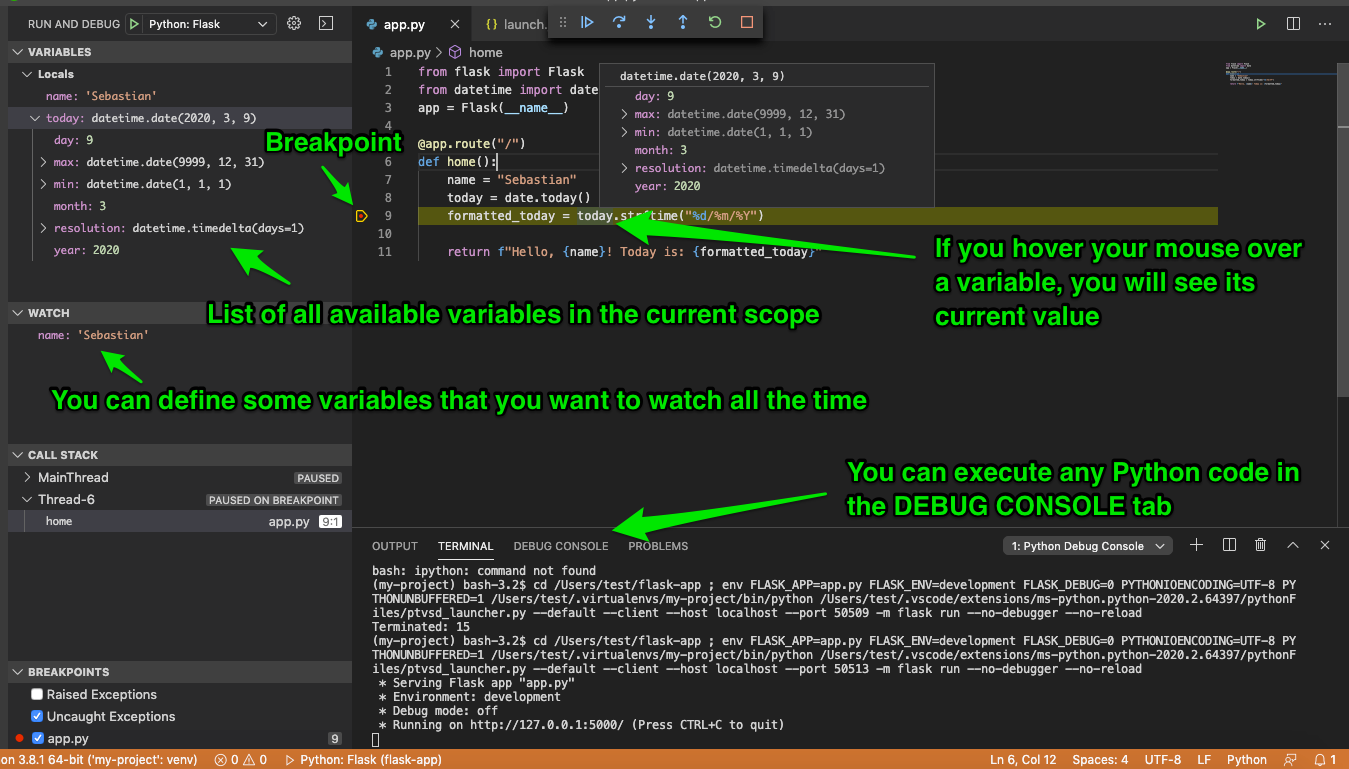
To start debugging your code, click on the left side of the line number - you will put a breakpoint there (indicated by a red dot).
If you start the server in the debug mode and open the page in your browser, so the code execution gets to that breakpoint, your interface will display a lot of new information:
The most important ones are:
- Yellow border around the active breakpoint (in our case, we have only one breakpoint). It shows where the code execution stopped.
- On the left side, you can see a list of all the currently available variables. We only have local variables in our example, but if we had some global variables, they would be displayed as well.
- Underneath you have the “Watch” section - you can add variables there, and VS Code will print their current value. It’s useful if you know in which variable you have a bug, and you want to see how it’s changing during the execution of your program.
- Then you have a “Call stack” and a list of active breakpoints.
At the top of the main window, you have a debug toolbar. It contains the standard set of buttons to:
- Continue the execution until the next breakpoint
- Execute the next line
- Step inside or outside of a function
- Restart the whole debugging section
- And stop the debugger
At the bottom of the window, next to the terminal, you have a “DEBUG CONSOLE” tab. You can use it to execute any Python code.